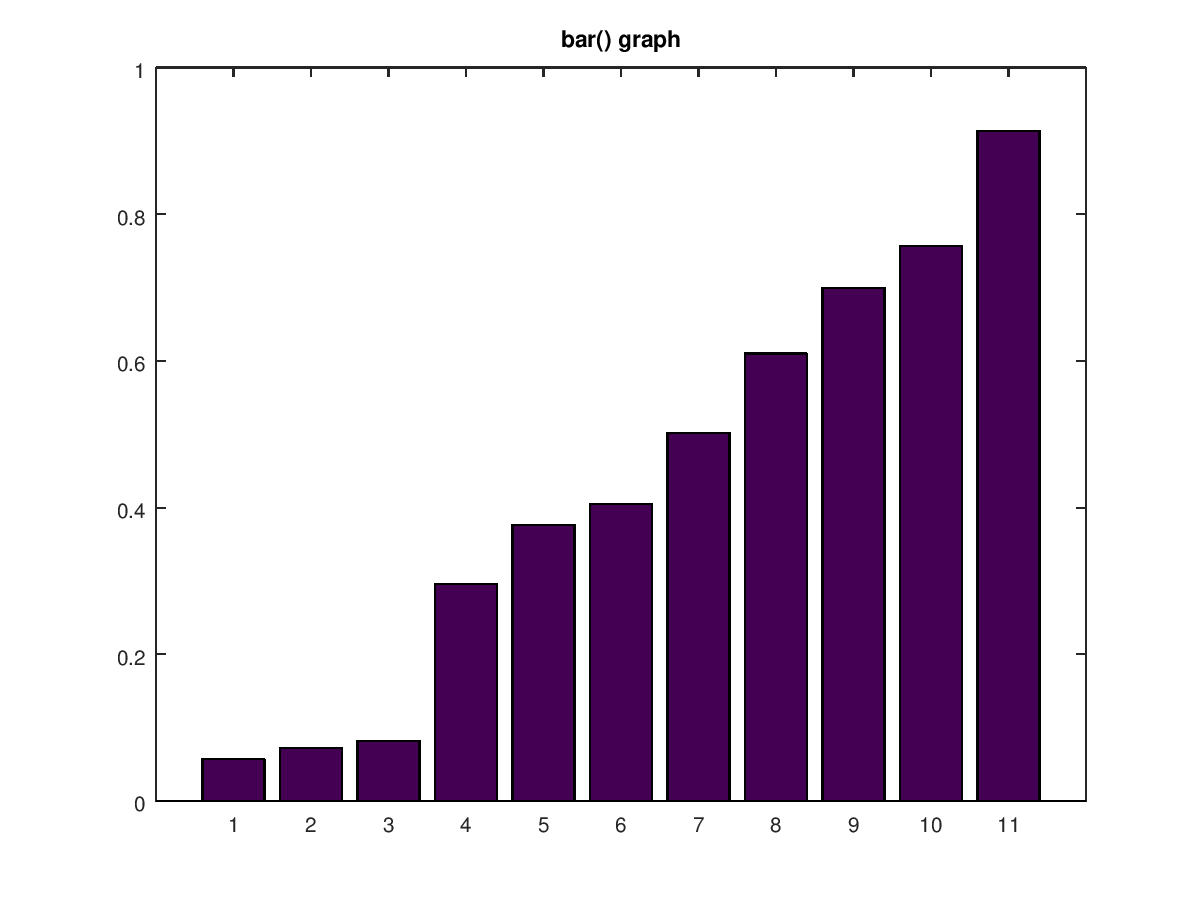
Create a column graph
Create a column graph from the data you gathered from activity 1.
Create a seperate graph for each environment (Dead trees, live trees and logs)
Questions
Who used the logs the most?
Who used the Live trees the most?
Can you give a reason why you think this is happening?
Compare and comment on the types of animals sighted at each type of den site and give a scientific reason why you think this is happening?
Do you have a question that you would like to ask the scientist that studied these animals?